Today’s scenario consists of a db.m6i.2xlarge Amazon RDS instance running Microsoft SQL Server Web Edition. A newer “greenfield” web application has a larger number of users hitting it during work hours.
An alert indicated that the server was nearing its CPU capacity. To start our investigation, we examine the instance’s Monitoring tab and see that the “CPUUtilization” metric indeed indicates an issue. This chart shows a server restart around the 17:35 mark to free up some resources. However, it quickly rockets back up.

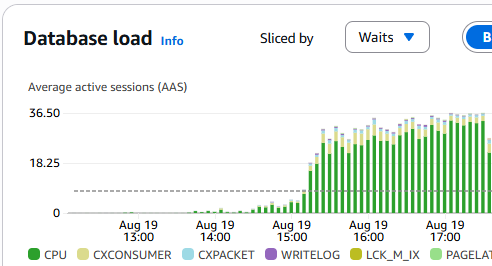
Next, we examine our Database Insights (which you will need to activate in advance). Here we see CPU waits exceeding our max vCPU threshold, indicating an issue.
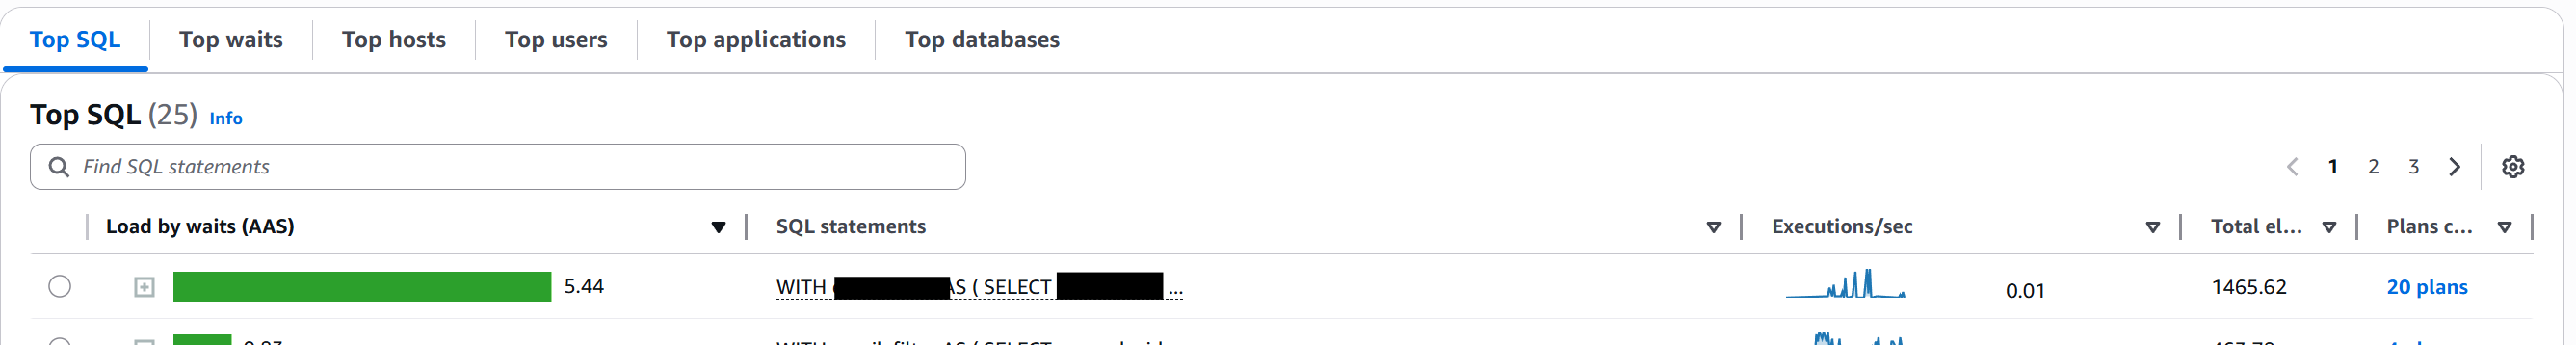
We then scroll down to the “Top SQL” tab and see that our most considerable wait (taking up 5.44% of the database load at the time of this screenshot, a few hours after the fix) is our target SQL query.
One of the items that we double-checked and found as an oversight was that the max degrees of parallelism (MAXDOP) parameter was set to 0 (unlimited). When using OLTP, or Online Transaction Processing, it’s best to set it to 1, effectively disabling parallelism. It ensures that no single query can consume too many resources, leaving processor cores available for other user requests. This improves overall system responsiveness and throughput.
However, after setting this to 1 and rebooting the instance, we found the primary issue remained. MAXDOP issues tend to be reflected as “CXPACKET” waits instead of “CPU” waits, and you can see all the “CXPACKET” waits, shown in light blue in the screenshot chart below, ceased at 18:30 when the parameter was changed from 0 to 1 and the server was emergency restarted.
During troubleshooting, developers optimized the query to join on a primary ID and then do a fuzzy search. Per the developer, the previous query was not utilizing the indexes properly.
At about 19:30 on the chart, the optimized query was pushed to production. The SQL Server was then emergency restarted to clear the hanging queries. You can see that the issue was then resolved with a practical database load and wait metric.

Random monitoring for a few hours confirmed that the fixes have resolved the issue.
In conclusion, utilize AWS RDS’s database insights and CloudWatch monitoring tools to look for clues. Often, on an OLTP stack, database waits become an issue that manifests as slow-loading web pages. Use application performance monitors (APM) such as FusionReactor for ColdFusion and Lucee servers to help you narrow down troublesome issues.
As a side note, while restarting production databases during normal hours is never great, you have to weigh the benefits. In this case a minute or two of downtime won over endless lag. Credit goes to Amazon RDS for a very speedy server restart. We were back up within a minute or two at most after hitting restart!